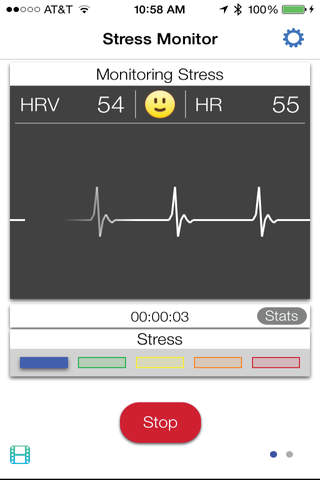
ResilienceZone app for iPhone and iPad
Developer: Proactive Rehab Ltd
First release : 31 May 2015
App size: 22.78 Mb
The next big trend in bio-hacking is understanding the relationships between different metrics. ResilienceZone integrates and correlates data from popular fitness platforms like MapMyFitness, Fitbit and Withings.
By analyzing HRV and Stress along with additional data, ResilienceZone provides a deeper dive into health and provides insight into what activities you engage in that effect the health metrics you care about.
IMPORTANT: ResilienceZone requires external hardware:
A tested Bluetooth Low Energy Heart Rate Monitors for iPhone 4S and Newer, iPad 3 and newer, iPod touch 5
Please visit www.BeatHealthy.com for a list of compatible Heart Rate Monitors noting that the Wahoo and 60Beat dongles are not supported.
ResilienceZone has four main components:
Monitor Stress
HRV for Training
Food Sensitivity
Data Correlation
Monitor Stress:
With ResilienceZone, you can see your stress levels in real time, giving you the ability to take action to reduce stress. If your chosen stress threshold is reached, ResilienceZones Relax screen prompts you with a deep breathing screen that includes calming images.
NEW Stats: The stats screen more widely referred to as the geek screen, shows all the metrics being measured. If using the HealthPatch, the user can view the additional provided metrics.
NEW Graph: The graph screen shows a real-time building graph of your heart rate from RR Intervals. Turning the phone 90 degrees counter-clockwise will bring up the graph in landscape.
NEW Export RR Intervals: ResilienceZone provides RR interval export capability.
HRV For Training:
In competitive sports, improved performance is often affected by alternating periods of intensive training with periods of relative rest. ResilienceZone measures HRV, an objective measure of your bodyís response to each workout and provides training recommendations based on the morning reading.
Food Sensitivity Test:
If you are sensitive to certain foods, you may not experience symptoms, though your body reacts by elevating your heart rate after eating an offending food. Low level food sensitivities may contribute to inflammation. This inflammation tells the body to hang onto stored fat to combat whatever stress caused the hormonal release. ResilienceZone measures your pulse three times after eating and assigns either a X (sensitive) or a green checkmark (not sensitive).
NEW Correlation:
The correlation screen uses a patent pending algorithm to correlate all of the data the user has shared with ResilienceZone. This data will come from the app itself and any other apps or devices the user has authorized (Fitbit, Withings, and/or MapMyFitness).
The correlation feature turns your data into useful information and provides insight into what combination of activities lead to desired HRV, stress or weight, giving you the knowledge you need to achieve your health and fitness goals.
ResilienceZone Features:
Post your session summary on Facebook and Twitter to share with friends.
Customize your Relax screen images with your favorite pictures.
Track your heart rate recovery after exercising.
Track the foods you have eaten and your bodyís response to them.
Save and upload sessions to your secure MySweetBeat account at www.BeatHealthy.com.
Email your RRs and session data for personal analysis off-line


